Make Smarter Business Decisions with Real-Time POS Analytics & Reporting
REPORTS & ANALYTICS
Make Smarter Business Decisions with Real-Time POS Analytics & Reporting
Get a complete view of your retail performance with iSmartSync’s advanced POS analytics and reporting dashboard. Track sales, revenue, profit, and staff performance in real time—across all stores, branches, and sales channels. Generate automated daily, weekly, and monthly reports to identify trends, monitor inventory flow, and measure growth with precision.
REPORTS & ANALYTICS
Make smarter business decisions with real-time POS reporting
From daily sales summaries to inventory movement and cashier performance—iSmartSync turns transactions into clear, exportable insights across all branches.
Operational insights, out of the box
Multi-store filters you’ll actually use
Choose date range, branch, counter/register, staff, status, and payment method—then export PDF/Excel instantly.
Live
Sales + refunds + net clarity
See gross sales, refunds, discounts/tax, and net—cleanly summarized for daily P&L-style review.
Mix
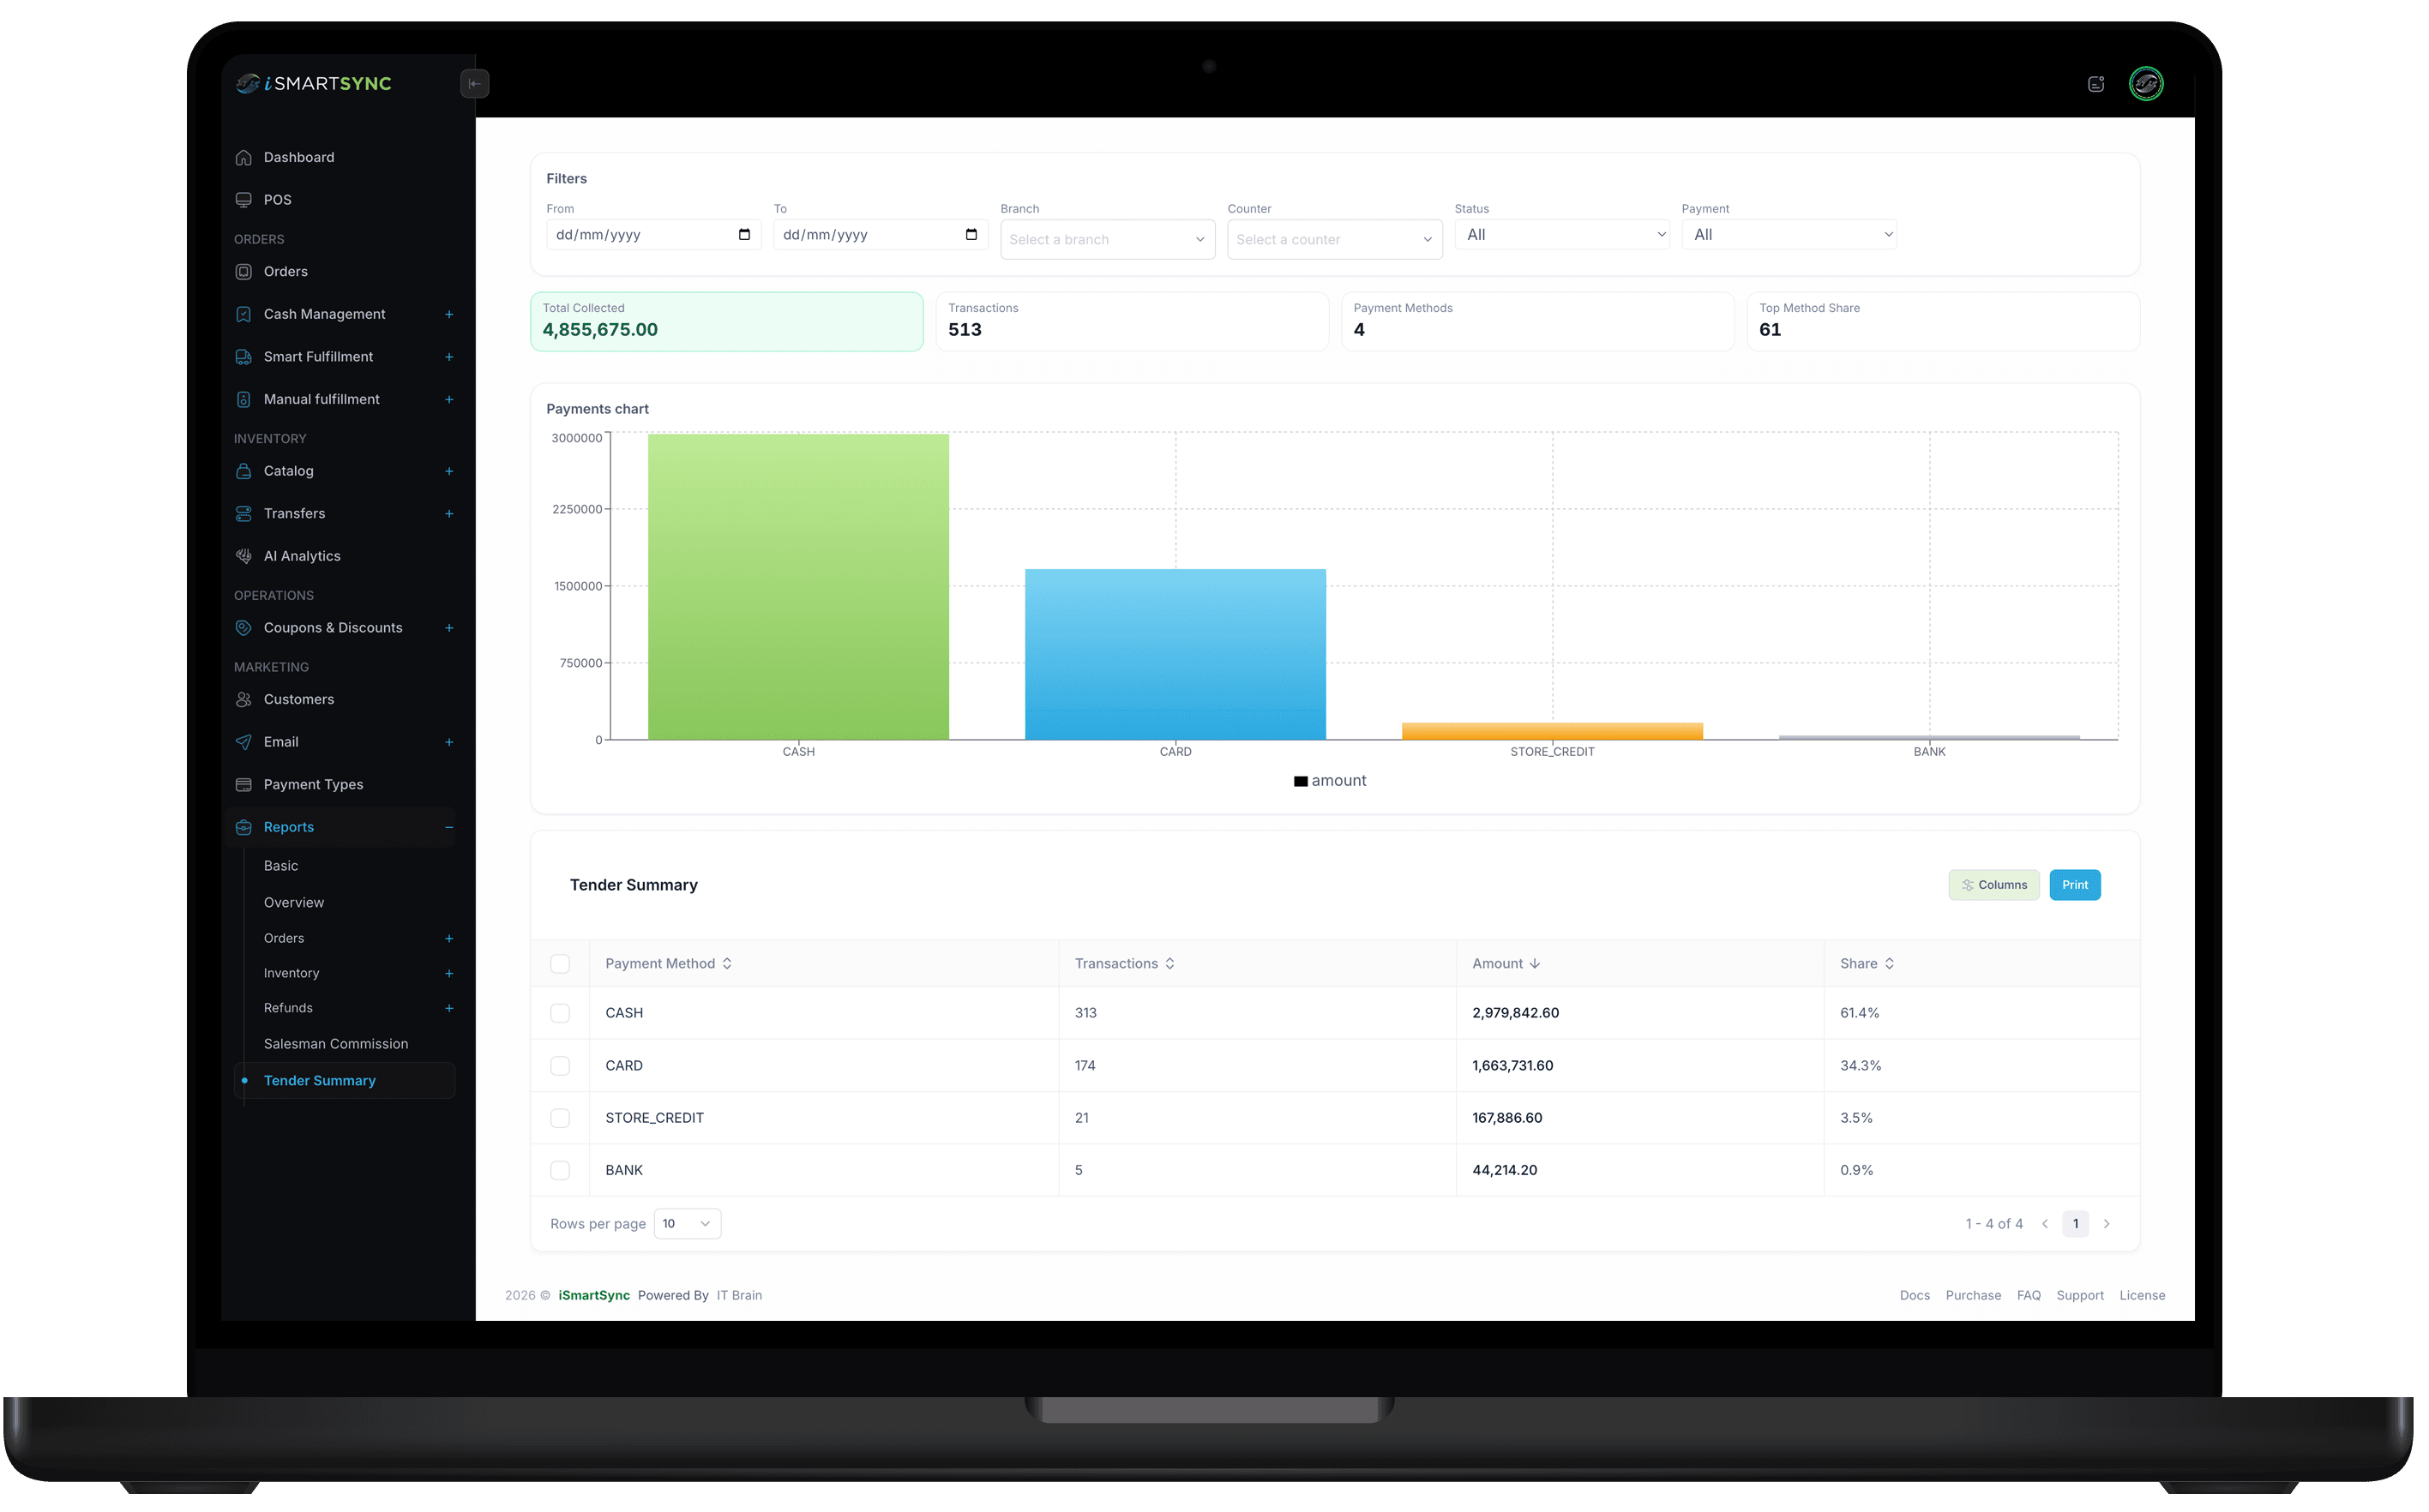
Tender breakdown
Cash, Card, Bank, Store Credit—so reconciliation is simpler and finance stays aligned.
Top
Product & category performance
Product-wise and category-wise sales, discounts, and refunds—drill to line-item detail when needed.
“Reporting principle”
“Reports should be decision-ready: filter fast, drill down, then export clean—without spreadsheets.”
— iSmartSync Reports
Reports that turn POS data into actionable insights
iSmartSync helps you move from raw transactions to clear answers. Monitor revenue, refunds, tender mix, products, staff performance, and inventory movement in real time—then drill down to order-level detail when you need proof. With multi-branch filters and export-ready layouts, your team can run daily operations faster and keep finance aligned without spreadsheets.
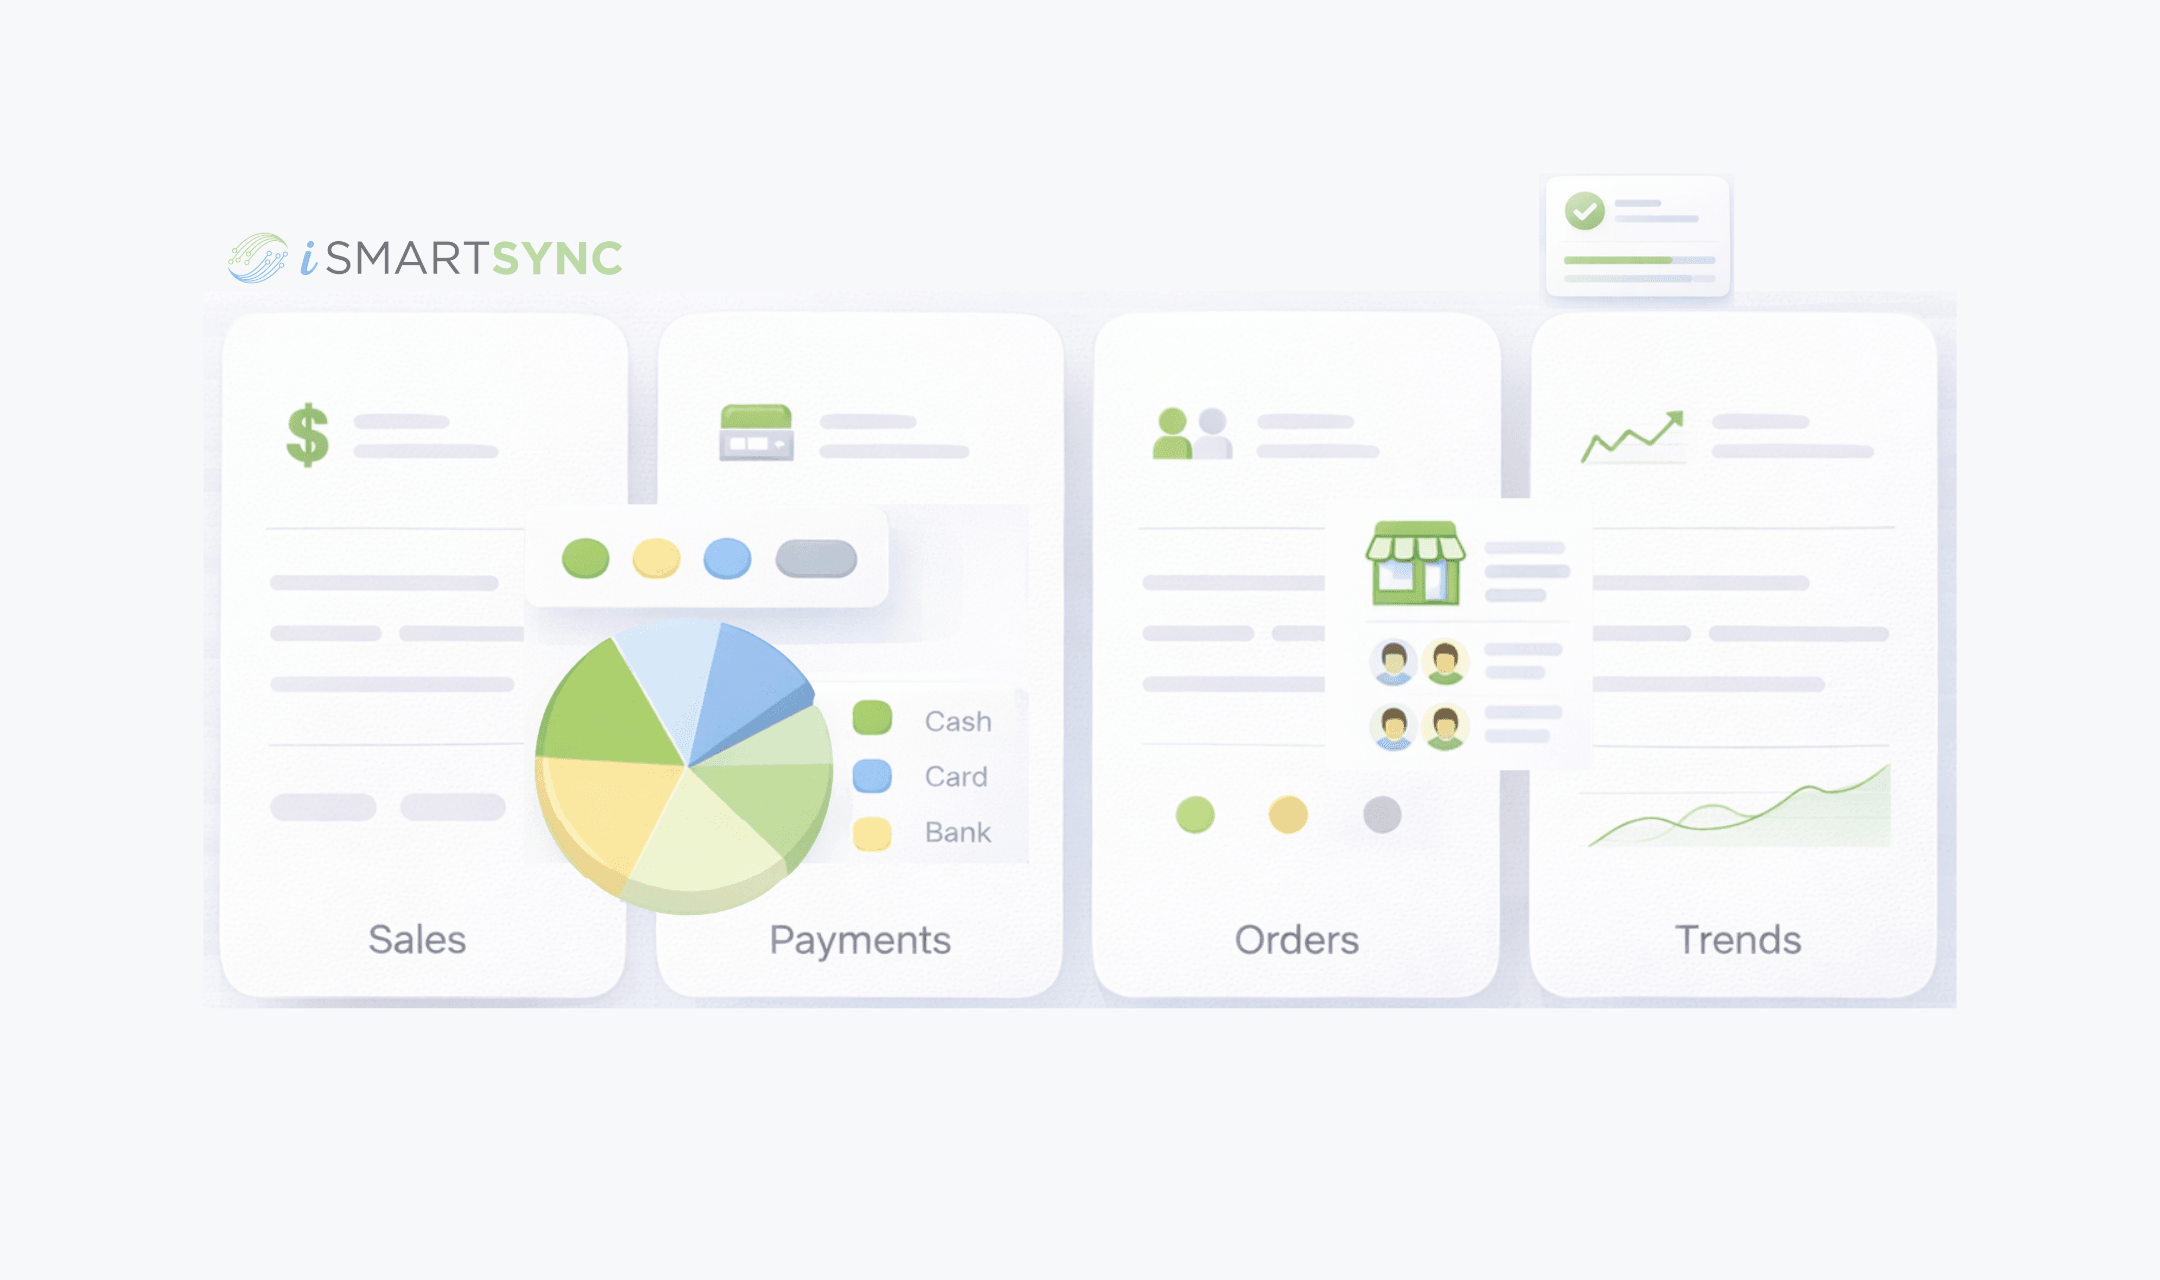
Every report you need—organized for retail operations
From sales summaries to inventory movement and cashier performance—everything is filterable, printable, and export-ready.
Sales Summary & Order Reports
Daily sales summary reports with totals you can trust—gross, discounts, tax, refunds, net—plus order-level drilldowns.
- Daily / weekly / monthly snapshots
- Order status breakdown and drill to details
- Export-ready PDF/Excel for finance
Tender Summary (Payment Mix)
See how money moved: Cash, Card, Bank, Store Credit—so reconciliation and settlement are faster.
- Tender totals + share (%)
- Branch/counter filters
- Print-friendly for end-of-day close
Refunds Summary & Details
Track refund leakage early with totals, counts, rate, averages, and tender-wise breakdowns.
- Refund amount + count + rate
- Refund tender breakdown
- Drill into refund details per order
Products: Summary & Details
Product-wise sales reports and line-item detail for category performance, bestsellers, and discount impact.
- Item & category-wise performance
- Quantity, net, discounts, refunds
- Export for buying/merch teams
Staff & Cashier Performance
Cashier performance reports + commission visibility to coach teams, detect anomalies, and align incentives.
- Salesman commission summary
- Orders handled + net contribution
- Supports incentives and coaching
Inventory & Stock Intelligence
Inventory stock level reports plus movement analytics to reduce stockouts and identify shrink/mismatch patterns.
- Inventory audit report
- Inventory movement (date/product-wise)
- Shop stock and snapshot utilities
Heatmaps & Trends
POS data visualization that shows hourly patterns so you can staff smarter and plan promotions.
- Hourly heatmap by day-of-week
- Spot peak windows and slow hours
- Improves staffing and prep
Customers & Loyalty
Customer purchase reports plus loyalty ledger activity—earn/redeem/adjustments with running balance.
- Customer order history view
- Loyalty ledger timeline + balances
- Useful for support and campaigns
Compliance & Invoice Reporting (FBR)
Taxable sales and invoice visibility with issuance status—built for operational compliance workflows.
- FBR summary + drill to detail
- Invoice refs and totals
- Export for finance and audits
CORE CAPABILITIES
Retail operations built on real movement
iSmartSync is a Shopify-dependent POS that tracks inventory the way stores actually work — across counters, branches, and online orders.
Shopify ↔ POS real-time handshake
Shopify creates online orders. iSmartSync controls in-store sales and physical stock movement. Both update each other live — no syncing delays, no duplicate inventory logic.
Explore Shopify handshakeMovement-based inventory system
Stock updates only when items are sold, packed, transferred, or returned — never when an order just appears online.
Explore inventory logicPOS-driven Shopify order fulfillment
Process online orders from POS — pack, dispatch, return, or exchange items with full branch context and inventory safety.
Explore order fulfillmentMulti-branch stock control
Each branch maintains its own stock, transfers, and audit trail — mapped cleanly to Shopify locations without breaking counts.
Explore branch managementReal-time sales across counters & online
Track POS counter sales and Shopify orders together — with live stock impact and unified reporting.
Explore real-time salesReturns, exchanges & RMA logic
Handle cancellations, refusals, and returns without inventory mismatch — restock only when goods physically come back.
Explore returns & exchangesAI-powered retail analytics
AI analyzes real sales and stock movement to highlight trends, slow-moving items, and operational risks — not guesses.
Explore AI analyticsProduct, variant & barcode system
Import products from Shopify, manage variants, and generate barcodes instantly — no spreadsheets required.
Explore barcode systemAudit-ready analytics & reporting
Every sale, movement, and adjustment is traceable — know who did what, where, and when.
Explore analyticsWHY TEAMS LOVE iSMARTSYNC REPORTS
Decision-ready reports—without spreadsheets.
Real-time POS analytics and reporting for sales, refunds, tenders, staff, products, inventory, and multi-branch performance—built for retail operations.
Always current
Totals update as orders and refunds happen—so the numbers stay honest.
Branch & counter filters
Zoom into one store or roll up all stores instantly—no manual work.
PDF/Excel-ready
Print-friendly layouts and clean exports for finance, ops, and audits.
How to connect Shopify with iSmartSync POS
Authorize once. iSmartSync stays connected to Shopify across inventory, orders, and stores.
Authorize Shopify
Securely connect your Shopify store. Products, variants, customers, and orders sync automatically.
Book a demoImport locations & create branches
Fetch your Shopify locations and map them to physical branches. Each branch maintains its own stock.
See location setupImport products & prepare inventory
Bring products directly from Shopify — variants, pricing, and stock — without spreadsheets. Conflict-aware imports keep inventory clean and aligned.
See product importFAQ
POS Reporting FAQs
Answers about multi-store analytics, exports, transaction drilldowns, and real-time reporting.
POS ANALYTICS & REPORTING
Want real-time POS reports without spreadsheets?
real-time reports
Track sales, revenue, refunds, tenders, products, staff performance, and inventory flow across branches—then export clean PDF/Excel summaries in one click.